Tracking down a lost interrupt: NVMe, Intel VMD and 30 seconds
9 min read
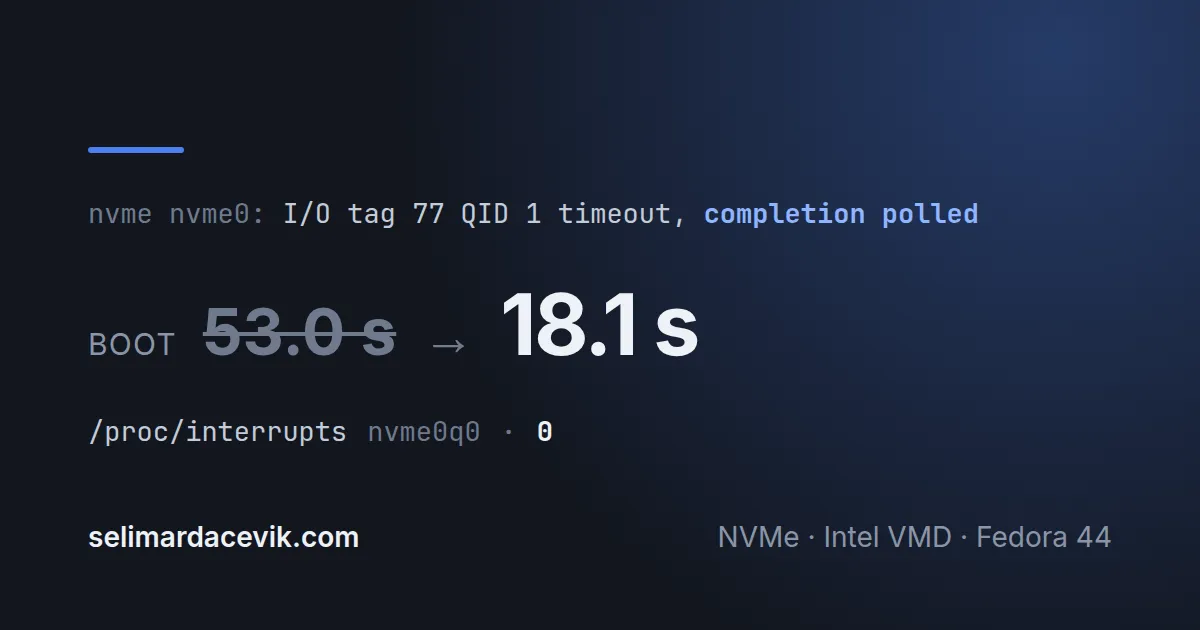
I had two complaints about a new laptop, and I was treating them as separate problems.
The first: booting took 53 seconds. An absurd number for a machine with an NVMe SSD, 16 cores and 32 GB of RAM. The second: the first Chrome launch of the day took forever. You click the icon, nothing happens. You click again, still nothing. Then two windows open at once.
There was one cause, and it was not a failing disk.
The kernel was already saying it
nvme nvme0: I/O tag 77 (104d) QID 1 timeout, completion polledRead that line as follows. The kernel sent a command to the drive. The drive
completed it. But the completion interrupt never arrived. The kernel waited
out the full 30-second timeout (nvme_core.io_timeout), then gave up, polled
the queue by hand — completion polled — and found the command had finished
long ago.
No data loss, no failing hardware. The only thing lost is an interrupt. The price is 30 seconds, and during those 30 seconds everything that touches the disk freezes.
Evidence 1: 31 seconds of the boot were one stall
systemd-analyze almost handed me the culprit:
$ systemd-analyze
Startup finished in 7.093s (firmware) + 2.384s (loader) + 1.568s (kernel)
                  + 3.244s (initrd) + 38.753s (userspace) = 53.044s

$ systemd-analyze blame | grep -v '\.device$' | head -3
30.836s initrd-switch-root.service
22.381s fwupd.service
 6.370s NetworkManager-wait-online.service
30.8 of the 38.7 userspace seconds sat in a single unit. But the real evidence was in the journal, and it took the form of an absence: between 4.74 and 35.66 seconds, not one line was written. Thirty-one seconds of complete silence. The line that broke the silence was the timeout itself:
[    4.741257] systemd[1]: Closed systemd-udevd-control.socket
[   35.663220] kernel: nvme nvme0: I/O tag 77 QID 1 timeout, completion polled
30.92 seconds apart. nvme_core.io_timeout is 30 seconds. The boot’s lost time
matched the length of a single timeout exactly.
An i915 GSC proxy component didn't bind within the expected timeout error
sitting right next to it distracted me for a while. It was a consequence, not a
separate problem: mei_gsc_proxy bound at 36.24s, the moment the disk came
back.
Evidence 2: the Chrome freeze was the same stall
I went looking for the same pattern in the Chrome complaint, and found it:
[  340.004125] kernel: nvme0: I/O tag 735 QID 1 timeout, completion polled
[  340.167394] chrome: ERROR:process_singleton_posix.cc:347]
               Failed to create .../SingletonLock: File exists (17)
[  341.149448] chrome: Opening in existing browser session.
Chrome had been started around 310s and stalled while reading its profile. When
nothing appeared, I clicked a second time — the SingletonLock: File exists
line is exactly the fingerprint of that second click. Both came alive at
340.00, the second the timeout resolved.
Chrome itself was not slow. With the same profile (394 MB, 16 extensions) and a warm page cache, it measured 0.28 seconds. The whole difference was the disk.
Evidence 3: it happened on every boot
I checked earlier boots to see whether this was a one-off:
for b in 0 -1 -2 -3 -4; do
  echo "boot $b: $(journalctl -b $b | grep -c 'completion polled')"
done
boot 0: 2
boot -1: 7
boot -2: 2
boot -3: 4
boot -4: 1Seven times in one session. Seven times thirty seconds.
The wrong hypothesis: APST
My first theory was APST (Autonomous Power State Transition): the drive drops into a low-power state when idle and misses an interrupt on the way back up. Plausible, and the measurement backed it — the drive really was sleeping aggressively:
$ sudo nvme get-feature /dev/nvme0 -f 0x0c -H
Autonomous Power State Transition Enable (APSTE): Enabled
Entry[0]  Idle Time Prior to Transition: 100 ms   -> power state 3
Entry[3]  Idle Time Prior to Transition: 2000 ms  -> power state 4
A drive that sleeps after 100 milliseconds of idle. So I turned it off:
sudo grubby --update-kernel=ALL \
  --args="nvme_core.default_ps_max_latency_us=0"
It did nothing. The boot with that parameter stalled exactly as before:
[   35.684191] nvme0: I/O tag 0   QID 6 timeout, completion polled
[   96.870108] nvme0: I/O tag 257 QID 5 timeout, completion polled
[  127.078093] nvme0: I/O tag 256 QID 5 timeout, completion polled
[  227.942038] nvme0: I/O tag 930 QID 3 timeout, completion polled
Worse, on that boot the login screen never appeared. Black screen. My first reaction was that I had broken the system with the kernel parameter, but the previous boot’s journal said something else:
[  127.078] nvme0: I/O tag 256 QID 5 timeout, completion polled
[  128.163] plasma-login-kwin_wayland.service: Failed with result 'timeout'
[  128.216] plasma-login-greeter: no Qt platform plugin could be initialized
[  128.314] systemd-coredump: Process 1386 (plasma-login-wa) dumped core
The chain reads cleanly: this time the stall landed on the display manager’s
startup path. plasma-login-kwin_wayland exceeded systemd’s start timeout and
was killed. With no Wayland compositor, the greeter could not initialize a Qt
platform plugin and crashed. The screen stayed black.
The lesson there has nothing to do with the parameter: “it won’t boot” is not
always a boot failure. The system had booted; what was missing was the login
screen. When that happens, reading the previous boot’s journal with
journalctl -b -1 beats guessing. The cause was sitting there in plain text.
The actual cause: Intel VMD
The next question was where the interrupt was getting lost.
/proc/interrupts answered directly:
178: ... VMD-PCI-MSIX-10000:e1:00.0 0 nvme0q0Two things in that line. First, VMD-PCI-MSIX: the drive was not attached
directly to PCIe but through Intel VMD (Volume Management Device), a layer
that sits between NVMe controllers and the CPU and multiplexes their
interrupts.
Second, and more striking, the counter: zero. The drive had served tens of thousands of I/Os and not one interrupt had been counted. They were being aggregated in the VMD layer, and occasionally dropped there.
The drive itself made things worse — it is a DRAM-less model:
Micron 2500 NVMe SSD (DRAM-less) [1344:5425]
kernel: nvme nvme0: allocated 64 MiB host memory buffer (16 segments)
It has no cache of its own; it borrows 64 MiB of system RAM to hold its mapping tables (HMB, Host Memory Buffer). So the drive is constantly doing DMA into system memory. Pushing that traffic through VMD’s address and interrupt remapping is where things went missing.
The fix is in the BIOS
In the ASUS BIOS: Advanced → VMD Configuration → Enable VMD controller: Disabled.
The drive now sits directly on PCIe:
$ lspci -nn | grep -i non-volatile
01:00.0 Non-Volatile memory controller: Micron 2500 NVMe SSD (DRAM-less)
And interrupts are actually counted:
$ grep nvme0q /proc/interrupts | head -2
159: ... IR-PCI-MSIX-0000:01:00.0    0-edge   nvme0q0
160: ... IR-PCI-MSIX-0000:01:00.0    1-edge   nvme0q1
total: 34663 interrupts      (with VMD: 0)
One warning. Sources recommend generalizing the initramfs before making
this change (sudo dracut --regenerate-all --force --no-hostonly), because if
the initramfs has no nvme driver the system will not boot once VMD is off. I
did not run it and the machine came up fine — Fedora’s initramfs already
includes nvme. Preparing the initramfs first is still the risk-free path. If
you want to go back, setting VMD to Enabled again is enough; the root
filesystem is mounted by UUID=, so the device path changing does not matter.
One small win found along the way: NetworkManager-wait-online was blocking
the critical chain on wifi DHCP. Pointless on a desktop, and it cost 6.4
seconds.
sudo systemctl disable NetworkManager-wait-online.serviceResult
$ systemd-analyze
Startup finished in 7.190s (firmware) + 2.745s (loader) + 1.587s (kernel)
                  + 3.738s (initrd) + 2.879s (userspace) = 18.141s

$ journalctl -b | grep -c "completion polled"
0| Before | After | |
|---|---|---|
| firmware | 7.1 s | 7.2 s |
| loader | 2.4 s | 2.7 s |
| kernel + initrd | 4.8 s | 5.3 s |
| userspace | 38.8 s | 2.9 s |
| total | 53.0 s | 18.1 s |
| stalls per boot | 1–7 | 0 |
Note that only userspace moved: firmware and loader stayed the same. That is what you would expect — the problem was not where the disk is first read, but where the system starts hammering it.
Chrome was measured after a fresh boot with no prior launch, so the cache was genuinely cold:
GPU process : 0.051 s
Renderer    : 0.091 s
A launch that used to freeze for 30 seconds now takes under a tenth of a second.
Reverting the APST parameter
The kernel parameter left behind by the wrong hypothesis was still there. I already knew it did nothing, but leaving it had a cost: with APST off, the drive never idles down and burns power for no reason.
sudo grubby --update-kernel=ALL \
  --remove-args="nvme_core.default_ps_max_latency_us"
The boot without it was identical to the boot with it:
$ grep -c nvme_core /proc/cmdline
0
$ cat /sys/module/nvme_core/parameters/default_ps_max_latency_us
100000                        # APST on again
$ journalctl -b | grep -c "completion polled"
0
$ systemd-analyze
... = 18.147s
18.147 against 18.141 is measurement noise. So disabling VMD was the only thing that ended the stalls; the drive can keep sleeping when idle, at no cost.
Skipping this step would have been easy — the problem was already fixed. But a parameter that has been proven not to work, left sitting on the kernel command line, becomes a variable you will stare at six months from now while debugging something else, wondering why it is there.
What I took away
Three things.
Silence is data too. The single observation that cracked this was that the journal had no lines at all for 31 seconds. We are trained to read what logs say; here the information was in what they did not.
An unmeasured hypothesis is not a fix. The APST theory was plausible, the
measurement supported it, and it was wrong. The nvme get-feature output said
“this drive sleeps aggressively” — true, and irrelevant. The question is not
“is this finding real” but “is this finding the cause of this problem”.
When two things look broken at once, one thing is probably broken. A slow boot and a frozen browser were two unrelated complaints; the common cause was that both were waiting out the same 30 seconds.
The note in my own files is longer and carries every command output. I write these down routinely now, because researching the same problem a second time from scratch is more annoying than the first.